
The table on the left is itself composed of two tables:
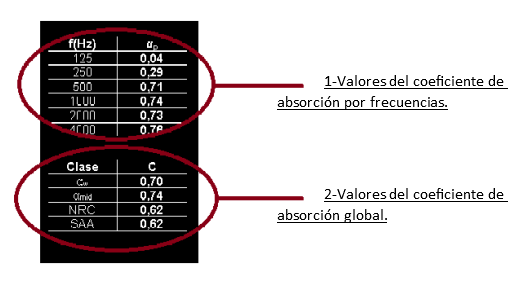
1- Values of the absorption coefficient by frequencies:
What is frequency?
If we take a musical instrument, for example, a guitar, when one of its strings is plucked, it produces a sound – a musical note. To produce the musical note, the plucked string vibrates around its initial position. Frequency is measured in Hertz (Hz) and is defined as the number of times per second the string vibrates. Thus, when you tune your guitar, you are adjusting the tension of the string so that it vibrates at the desired frequency when is plucked. For example, the note A is tuned to 440Hz, so that each time that note is plucked, the string that generates it vibrates at a rate of 440 times per second.
As sounds are made up of frequencies and the human ear does not perceive all frequencies in the same way, the ISO 354 standard – and in general all standards related to acoustic conditioning- establishes the frequencies at which the results should be presented, as these are considered to be the most representative.
These frequencies are 125, 250, 500, 1000, 2000 y 4000Hz. For each of these frequencies, the averaged value of the absorption coefficient obtained from the averaging of the frequencies adjacent to them is given. At the 4000Hz frequency, for example, the tested acoustic curtain has an absorption coefficient of 0.76. This means that for all sound waves with a frequency of 4000Hz, the acoustic curtain will absorb the 76% of them.
2-Weighted values of absorption coefficient:
The second table indicates different parameters of the weighted absorption coefficient. In other words, the absorption coefficient of these parameters is obtained by averaging the absorption coefficient of several frequencies. The differences in the results of these parameters are due to the frequencies chosen for averaging:
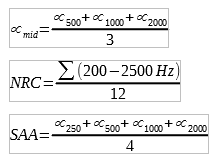
The parameter αmid is not given as it is not obtained by averaging, but by comparing the values obtained with reference values. The calculations are too complex to be given in this catalogue. However, the results are generally similar to those of the αw parameter. These two parameters are the most commonly used in room acoustics as they are considered to be the most representative.
On the left we find a graph:
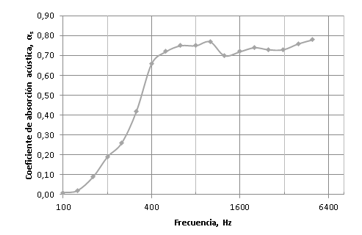
This graph shows the absorption coefficient values for the frequencies of 100, 125, 160, 200, 250, 315, 400, 500, 630, 800, 1000, 1250, 1600, 2000, 2500, 3150, 4000, 5000 Hz.